Chicago Soybean/Meal Price Trends
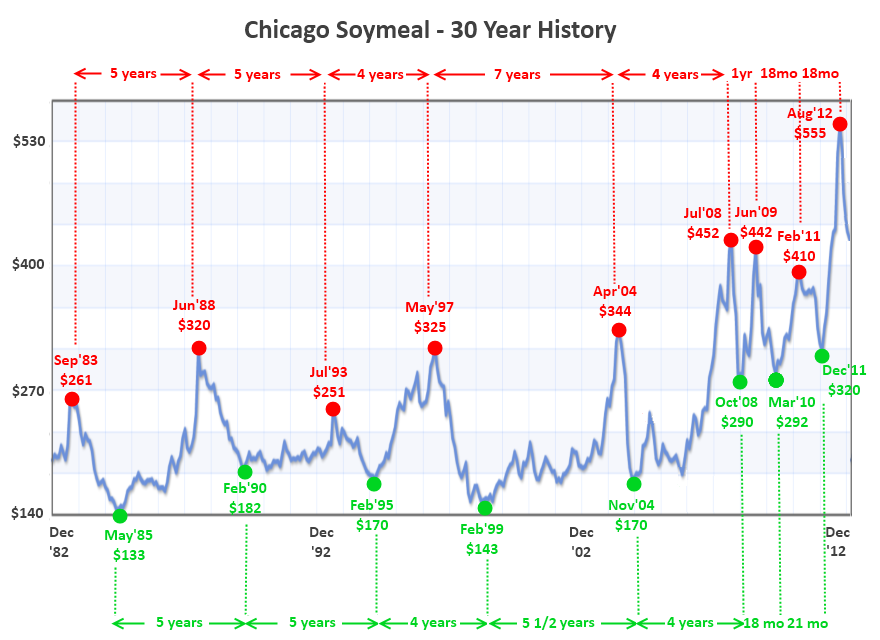
The chart above plots Chicago soybean meal over the past thirty years. The "exceptional" peaks and lows have gone from being around 4-5 years apart to only 12-18 months apart more recently. This appears to reflect increased money flows into - and sometimes out of - the commodities markets in the last 10 years. Note also that the time difference between the earlier price spikes and subsequent declines has generally been around 18 months. The last four market capitulations have seen much shorter gaps between the top and the bottom of the market, in the case of 2008 this was just three months!
Whilst fund money flooding into the market at times of a weather crisis is often attributed to being responsible for maybe the upper 20% of these price spikes, it should also be considered that a wholesale exodus of speculative money from the grains sector probably also drives prices lower than they really should go, presenting some spectacular buying opportunities.
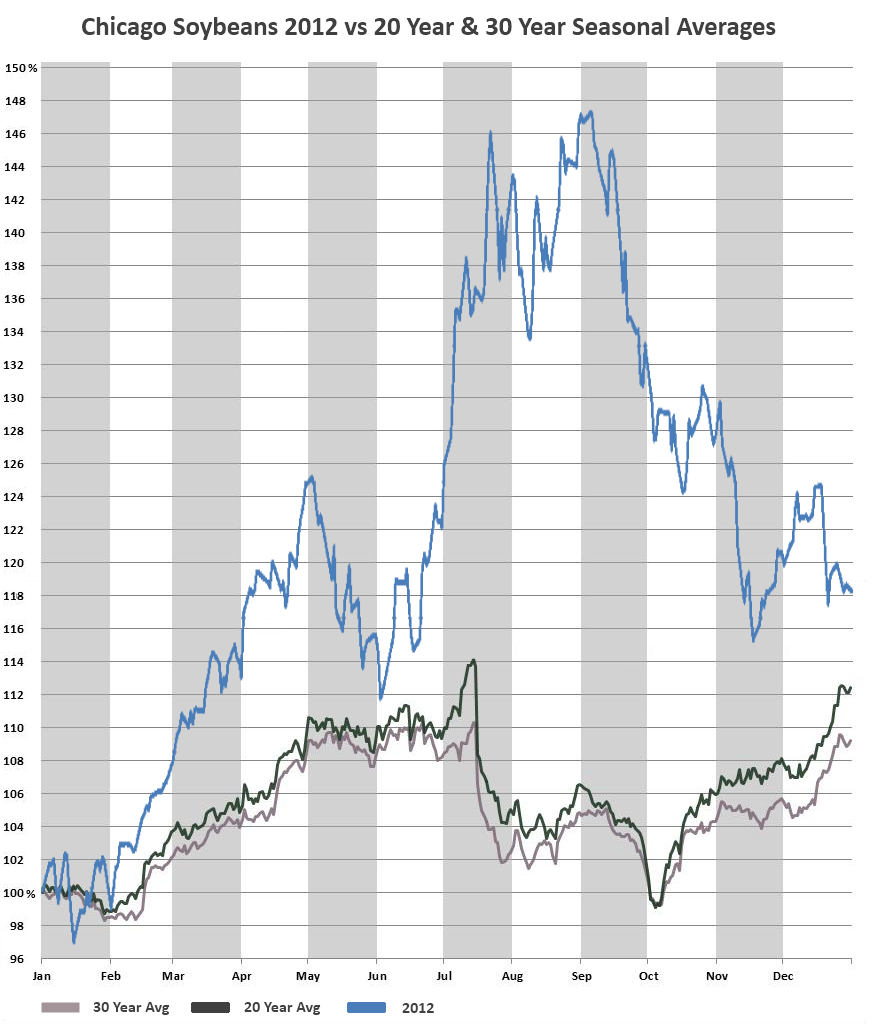
This chart shows the long-term seasonal trend for soybean prices in Chicago over the last 20 & 30 years. The values take the price of front month soybeans at the start of the year as being "100%" and plot their subsequent fluctuation throughout the remainder of the calendar year.
This chart highlights what an exceptional year 2012 was for soybean prices, with an unprecidented rally of almost 50% in value by late summer compared with the start of the year.
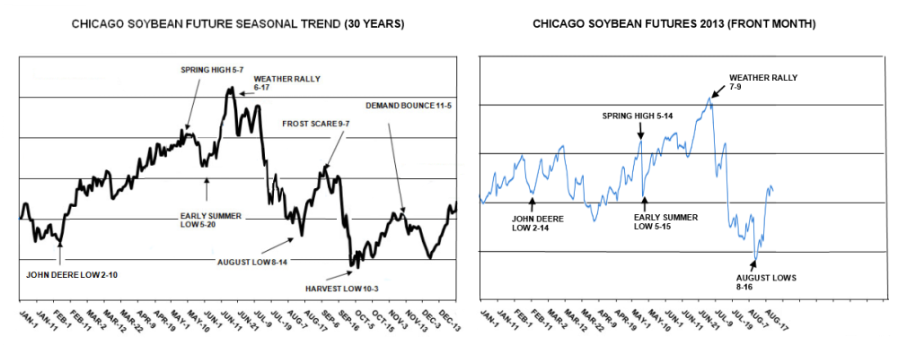
There is a very strong historical precident for prices to "bottom out" in February (although this happened in mid January in 2012), the so-called John Deere Low, when US growers traditionally fund farm equipment purchases ahead of spring planting by selling off physical soybeans.
Despite the harvest in South America then being underway, CBOT soybean prices frequently rise quite sharply through until the summer when the market has a much clearer idea of actual planted US acres. Prices have risen much more steeply than normal this year to all time highs which began with steady and significant downgrades to South American soybean production prospects throught the spring, followed by the worst drought since 1988 in the US this summer.
After peaking in July prices generally work lower during the August/September period, frequently punctuated by the odd weather scare, before hitting a post harvest low in early October. Once harvest pressure is over, a demand bounce carries us higher through to the end of the year before the whole cycle begins again.
If you need up-to-date competitive prices on UK DELIVERED SOYA then please contact the NWF Trading Team on 0800 262 397 who can provide them on a daily basis.
| www.rupertstafford.com | T:
01829 262 270 M: 07711 217 791 |